
Water Quality Testing
The City of Ottawa tests the water quality at all their beaches daily during the summer. Samples are taken daily for coliform and e-coli bacteria counts.
For water quality information, call 613-580-2424 ext. 13219. The information is updated at noon daily, based on the previous day’s water samples. The present and past readings are also available on the City’s website.
A no swimming advisory will be issued if bacteria levels are over 200 E. coli per 100 ml of water tested or if they are over 100 E. coli per 100 ml of water tested on 2 or more consecutive days. A 24-hour no swimming advisory will be issued after a rainfall of 20 mm or more.
2015 Water Quality
Using the water quality statistics provided by the City of Ottawa, we show below the number of days for which the beach was officially closed. We also show the number of days on which the E. coli count exceeded 100. This is not the same as when the beaches are officially closed, which is 200 counts.
| Beach | Red Flag Days | Days over 100 E. coli |
| Britannia | 7 | 6 |
| Mooneys Bay | 4 | 4 |
| Westboro | 7 | 8 |
| Petrie Island River Beach | 7 | 10 |
| Petrie Island East Beach | 5 | 7 |
2014 Water Quality
Using the water quality statistics provided by the City of Ottawa, we show below the number of days for which the beach was officially closed. We also show the number of days on which the E. coli count exceeded 100. This is not the same as when the beaches are officially closed, which is 200 counts.
| Beach | Red Flag Days | Days over 100 E. coli |
| Britannia | 4 | 0 |
| Mooneys Bay | 9 | 7 |
| Westboro | 12 | 9 |
| Petrie Island River Beach | 16 | 12 |
| Petrie Island East Beach | 8 | 4 |
2013 Water Quality
Using the water quality statistics provided by the City of Ottawa, we show below the number of days for which the beach was officially closed. We also show the number of days on which the E. coli count exceeded 100. This is not the same as when the beaches are officially closed, which is 200 counts. This year, the Petrie Island East Beach was the best beach in Ottawa in terms of water quality, with only 4 days when the E. coli count exceeded 100.
| Beach | Red Flag Days | Days over 100 E. coli |
| Britannia | 1 | 5 |
| Mooneys Bay | 13 | 15 |
| Westboro | 5 | 9 |
| Petrie Island River Beach | 13 | 9 |
| Petrie Island East Beach | 2 | 4 |
2012 Water Quality
Using the water quality statistics provided by the City of Ottawa, we show below the number of days for which the beach was officially closed. We also show the number of days on which the E. coli count exceeded 100. This is not the same as when the beaches are officially closed, which is 200 counts. Petrie’s East Beach had poorer water quality than the river beach, possibly due to Canada geese and sea gulls.
The role of rainfall on water quality is apparent this year. It was very dry in June and July, and the water quality was very good. This is thought to be due to runoff from the land.
| Beach | Red Flag Days | Days over 100 E. coli |
| Britannia | 7 | 8 |
| Mooneys Bay | 13 | 15 |
| Westboro | 3 | 6 |
| Petrie Island River Beach | 9 | 10 |
2011 Water Quality
The year 2011 was definitely worse for all of the Ottawa beaches. Petrie’s River Beach came in second best, behind Britannia Beach. Using the water quality statistics provided by the City of Ottawa, we show below the number of days for which the beach was officially closed. We also show the number of days on which the E. coli count exceeded 100. This is not the same as when the beaches are officially closed, which is 200 counts. For the second year in a row, Petrie’s East Beach had particularly poor water quality. It is thought that the number of Canada geese and sea gulls are responsible.
| Beach | Red Flag Days | Days over 100 E. coli |
| Britannia | 18 | 20 |
| Mooneys Bay | 26 | 29 |
| Westboro | 27 | 32 |
| Petrie Island River Beach | 22 | 26 |
2010 Water Quality
The year 2010 was the best year ever for water quality at Petrie Island. Petrie had the best water quality of all public beaches in Ottawa. Both beaches on Petrie Island were simultaneously closed for only 3 days. Using the water quality statistics provided by the City of Ottawa, we can compare the beaches. We show below the number of days on which the E. coli count exceeded 100. This is not the same as when the beaches are officially closed, which is 200 counts.
| Beach | Days Over 100 E. coli |
| Britannia | 7 |
| Mooneys Bay | 16 |
| Westboro | 11 |
| Petrie Island River Beach | 5 |
| Petrie Island East Beach | 17 |
It is likely that the large number of Canada geese were causing the problems on the East Beach. In 2009, the East Beach was generally better than the River Beach.
2009 in Review
The year 2009 was one of the best years ever for water quality at Petrie Island. This was despite July 2009 seeing the highest rainfall ever recorded for that month.
In 2009 the City implemented a new system for monitoring water quality at Petrie Island. The River beach and the East Bay beach were monitored separately, leading to fewer overall closures at Petrie. Previously the readings were lumped into a single number. Most times, the east beach was cleaner than the north beach, perhaps because it had less water circulation.
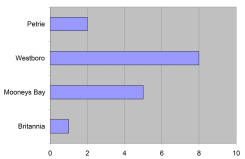
Using the water quality statistics provided by the City of Ottawa, we can compare all four beaches in Ottawa. The graph shows the number of days in which E. Coli counts exceeded 200 per 100 mL, the standard below which the water is considered safe for swimming. The beaches were closed on more days than this, as a precaution due to high rainfall on the previous day. The graph shows the number of days in which both beaches exceeded 200 counts.
Petrie Island was second only to Britannia Beach for water quality in 2009.
The 2006 Controversy
The year 2006 was the worst ever for water quality at Petrie Island. It was only discovered in 2008 that a gate valve in a sanitary sewer near Sussex Drive had been stuck open for several weeks, putting raw sewage directly into the Ottawa River. This led to Petrie Beach being closed for 45 days in 2006. The year 2007 was considerably better, with only 6 closures. Petrie Beach on average has better water quality than Westboro Beach, which was closed 22 times in 2007.
2007 Water Quality Study
As a result of the poor water quality in 2006, a study was performed in 2007 by Environment Canada. Read the report here. See also the report by Ottawa’s medical officer of health. Briefly, the study found that most of the contamination was due to human sources. Some of the “contamination” could be dead bacteria that were inactivated by chlorination at the sewage treatment plant. It is possible that the contamination in the sand is caused by seagulls. This was a problem at Mooneys Bay and Britannia Beach, and was solved by the installation of seagull netting.
Ottawa Citizen Article July 2009
Kate Jaimet of the Ottawa Citizen examines the problems of Ottawa’s combined sewers and how it relates to water quality.
Historical Water Quality Statistics
Below is a table provided by Friends of Petrie Island summarizing the historical water quality results. It shows the number of days on which the E. Coli readings exceeded 100 counts per mL. This is not the same as beach closures, as beaches are also closed as a precaution after large rainfalls. For Petrie, both beaches must be above 100 counts.
| 2000 | 2001 | 2002 | 2003 | 2004 | 2005 | 2006 | 2007 | 2008 | 2009 | 2010 | |
| Britannia | 30 | 19 | 18 | 2 | 4 | 2 | 2 | 2 | 1 | 3 | 7 |
| Westboro | 25 | 12 | 21 | 9 | 14 | 22 | 22 | 14 | 23 | 14 | 11 |
| Mooneys Bay | 12 | 3 | 5 | 1 | 1 | 27 | 12 | 2 | 5 | 11 | 16 |
| Petrie Island | 8 | 8 | 6 | 17 | 48 | 6 | 19 | 5 | 3 |